My technical skills
My favorites
My picture album
Shortcut keys
My code library
VB resources
SQLServer resources
SQLServer books
Replication FAQ
Scripting resources
ASP resources
Search my site
Sign my guestbook
Contact information
|
This month's 2 click survey: Is .NET important for a database professional? |
SQL Server Articles New
|
Click here to find out the top 15 SQL Server books purchased by this site's visitors! NEW |
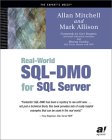
Featured Book:
|
Click here to read a sample chapter from the book: SQL Server Security Distilled |
| Want to keep in touch with the latest in SQL Server world? Email vyaskn@hotmail.com with 'subscribe' in the subject line |
How to use the new function fn_get_sql() and the new columns of sysprocesses introduced in SQL Server 2000 Service Pack 3 (SP3)?
Note: Information & code samples from this article are tested on SQL Server 2005 RTM (Yukon) and found to be working. Will update the article in case of any compatibility issues.
Microsoft SQL Server 2000 SP3 (SP3A) has introduced many security fixes, changes in functionality, and new features. In this article, I'm going to discuss one of the new features introduced in SP3, the fn_get_sql() function and the 3 new columns added to sysprocesses system table. The three new columns are:
| Column name | Data type | Description |
| sql_handle | binary(20) | Contains a handle to the currently executing batch/query/stored procedure. |
| stmt_start | int | Starting offset of the current SQL statement for the specified sql_handle. |
| stmt_end | int |
Ending offset of the current SQL statement for the specified sql_handle. -1 indicates that the current statement runs to the end of the results returned by the fn_get_sql function for the specified sql_handle. |
The new diagnostic function fn_get_sql() can be used to inspect a particular process (spid) to see which line of code is currently being executed. As I said, this is a diagnostic function, and it can be used to troubleshoot long running stored procedures and identify performance issues. This function accepts sql_handle (obtained from sysprocesses table) of a spid, as a parameter, and retrieves information about that spid. The other new columns, stmt_start and stmt_end are used to determine, which line of code (of the batch or stored procedure) is being executed (At the end of this article, I also provided links to useful SQL Server performance tuning books). 0 = Not encrypted
Prior to the release of SP3, we relied on the command DBCC INPUTBUFFER to see what code/query a particular process was executing. But it has some limitations. DBCC INPUTBUFFER can only display the first 255 characters of the batch or stored procedure. Also, DBCC INPUTBUFFER only displays the first command executed by the process. That is, nested stored procedure calls are not displayed. Meaning, if spid 55 executes procedure proc_1 and proc_1 calls another procedure proc_2, which in turn calls proc_3 and you execute DBCC INPUTBUFFER while proc_3 is being executed, you will see proc_1 as the output, not proc_3. fn_get_sql() overcomes all these problems, and can be used to pinpoint the line of code that is being currently executed.
For a given process, fn_get_sql() returns the following resultset (taken from SQL Server Books Online):
Column name
Data type
Description
dbid
smallint
Database ID. Is NULL for ad hoc SQL statements.
objectid
Int
ID of the database object. Is NULL for ad hoc SQL
statements.
number
smallint
The number of the group, if the procedures are grouped. Is 0 for
entries that are not procedures and NULL for ad hoc SQL statements.
encrypted
Bit
Indicates whether the object is encrypted.
1 = Encrypted
text
Text
Text of the SQL statement. Is NULL for encrypted
objects.
SQL Server 2000 Books Online (btw, you need to get the updated Books Online that got released with SP3) states that some SQL statements cannot be cached, and fn_get_sql() cannot inspect such processes. That is what I found in my testing as well. But I managed to find handles for almost all stored procedure calls. For more information and comments on fn_get_sql(), read up SQL Server Books Online.
Now it is time to see the new function in action. The following stored procedure 'ShowCodeLine' returns the currently executing line of a given spid. It accepts the following two parameters:
Parameter name
Data type
Description
@SPID
int
The process identification number (SPID) of a process to be examined. You can obtain the spid of a process, by looking at master.dbo.sysprocesses directly, or by running sp_who or sp_who2. You could also get the spid of a process from Profiler output. This is a mandatory parameter.
@WAIT
tinyint
This procedure ShowCodeLine inspects the specified process, repeatedly in an infinite loop, until the process completes. By specifying a valid value for this parameter, you could slow down the looping by the specified number of seconds. You could specify a value (in seconds) between 0 and 60 for this parameter. Default is 0. While inspecting a long running process a value >= 1 seconds would be ideal, to avoid too many output rows.
@NoLoop
bit
Defaults to 0. When 0, this procedure inspects the specified spid continuously, at specified intervals, until the spid completes. When 1, the specified spid will be examined only once, and the procedure terminates.
ShowCodeLine returns a value of 0 on successful completion, and -1 in case of any failures.
This procedure can be created in any database.
IF EXISTS
(
	SELECT 1
	FROM INFORMATION_SCHEMA.ROUTINES
	WHERE ROUTINE_NAME = 'ShowCodeLine'
	AND ROUTINE_SCHEMA = 'dbo'
	AND ROUTINE_TYPE = 'PROCEDURE'
)
BEGIN
	PRINT 'Procedure ShowCodeLine already exists...Dropping it and recreating'
	DROP PROC dbo.ShowCodeLine
END
ELSE
BEGIN
	PRINT 'Creating procedure ShowCodeLine'
END
GO

CREATE PROC dbo.ShowCodeLine
(
	@SPID smallint,
	@WAIT tinyint = 0,
	@NoLoop bit = 0
)
AS
BEGIN

	--Author: Narayana Vyas Kondreddi
	--Date Created: 20031016
	--Source: http://vyaskn.tripod.com


	SET NOCOUNT ON

	DECLARE @sql_handle binary(20), @handle_found bit
	DECLARE @stmt_start int, @stmt_end int
	DECLARE @line nvarchar(4000), @wait_str varchar(8)

	SET @handle_found = 0

	IF @WAIT NOT BETWEEN 0 AND 60
	BEGIN
		RAISERROR('Valid values for @WAIT are from 0 to 60 seconds', 16, 1)
		RETURN -1
	END
	ELSE
	BEGIN
		SET @wait_str = '00:00:' + RIGHT('00' + CAST(@WAIT AS varchar(2)), 2)
	END

	WHILE 1 = 1
	BEGIN
		SELECT	@sql_handle = sql_handle,
			@stmt_start = stmt_start/2,
			@stmt_end = CASE WHEN stmt_end = -1 THEN -1 ELSE stmt_end/2 END
			FROM master.dbo.sysprocesses
			WHERE	spid = @SPID
				AND ecid = 0

		IF @sql_handle = 0x0

		/*
			--If you are running this on SQL Server 2005, then change the above line to the following:

			IF(@sql_handle = 0x0) OR (@stmt_start = 0 AND @stmt_end = 0)

			--Without this change, this procedure might go into an infinite loop and needs to be killed
			--In SQL Server 2000, as soon as a batch completed,
			--the sql_handle column in sysprocesses becomes 0, but that's not the case in SQL Server 2005
		*/

		BEGIN
			IF @handle_found = 0
			BEGIN
				RAISERROR('Cannot find handle or the SPID is invalid', 16, 1)
				RETURN -1
			END
			ELSE
			BEGIN
				RAISERROR('Query/Stored procedure completed', 0, 1)
				RETURN 0
			END
		END
		ELSE
		BEGIN
			SET @handle_found = 1
		END

		SET @line =
		(
			SELECT
				SUBSTRING(	text,
						COALESCE(NULLIF(@stmt_start, 0), 1),
						CASE @stmt_end
							WHEN -1
								THEN DATALENGTH(text)
							ELSE
								(@stmt_end - @stmt_start)
    						END
					)
   			FROM ::fn_get_sql(@sql_handle)
  		)

		RAISERROR(@line, 0, 1) WITH NOWAIT

		IF @NoLoop = 1
		BEGIN
			RETURN 0
		END

		WAITFOR DELAY @wait_str

	END

END
GO
Now, to examine a process with spid 55, run the following:
EXEC dbo.ShowCodeLine 55
GO
To examine a process with spid 55, but every 2 seconds (instead of the default 0 seconds):
EXEC dbo.ShowCodeLine 55, 2
GO
In the stored procedure, notice that I used RAISERROR...WITH NOWAIT, to display the output. I did this, so that the output can be seen in Query Analyzer instantly (because of the NOWAIT parameter). But RAISERROR has a limitation, in that it only displays up to 400 characters. If you need to display more than 400 characters, replace the RAISERROR call with a SELECT, to display @wait_str. But the output of SELECT statement will not be displayed until the procedure completes or the output buffer is full. Also, if your Query Analyzer output mode is set to 'Grid' instead of 'Text', then remember to look at the 'Messages' tab of Query Analyzer's results pane, for output.
Here is a quick way to test the procedure 'ShowCodeLine':
1. Open two query windows in your Query Analyzer (QA) and make sure, both the windows are connect to the same SQL Server instance.
2. In the first window, create the following stored procedure:
CREATE PROC dbo.TestProc
AS
BEGIN
WAITFOR DELAY '00:00:01' --Waits for 1 second
WAITFOR DELAY '00:00:02' --Waits for 2 seconds
WAITFOR DELAY '00:00:03' --Waits for 3 seconds
WAITFOR DELAY '00:00:04' --Waits for 4 seconds
WAITFOR DELAY '00:00:05' --Waits for 5 seconds
END
GO
Because of the WAITFOR commands, the above stored procedure runs for at least 15 seconds. That is a good enough duration for us to examine this procedure using ShowCodeLine.
3. Now record the spid of this first Query Analyzer connection using the system variable @@SPID:
SELECT @@SPID
GO
Note down the resulting spid number from the above command, as we will need to pass it to ShowCodeLine, in the second Query Analyzer window. For this example's sake, assume that the output was 625.
4. In the same Query Analyzer window (first one), run the procedure TestProc:
EXEC dbo.TestProc
GO
5. Quickly switch to the second Query Analyzer window and execute ShowCodeLine, by passing the previously recorded spid:
EXEC dbo.ShowCodeLine 625
GO
In the 'Messages' tab of the second Query Analyzer window's results pane, you will see the code lines from the procedure TestProc being displayed as they are executed.
Note: When you try to examine the spid of an extended stored procedure, using ShowCodeLine, you will only see the name of the extended stored procedure in the output.
As you just observed, you could use ShowCodeLine to see what line of code, a long running stored procedure is currently executing. Also, when a particular stored procedure is blocked, you could use ShowCodeLine to see which line of that stored procedure is blocked. This is especially useful for long batches or lengthy stored procedures. This procedure can be used in conjunction with SQL Profiler for effective troubleshooting and performance tuning of queries.
Before we end, here is a list of SQL Server performance tuning books. Hope you find them as useful as I did.
